The ARISE 2014 baseline report “Cradle to Community Success: Creating a Path Forward” is a snapshot-in-time report showing the starting point for the educational data ARISE is tracking in Anchorage. From this starting point, we can track our progress as we work to affect the outcomes and data indicators the leadership council has identified, and the report will be updated annually.
In 2015 our Priority Outcomes are:

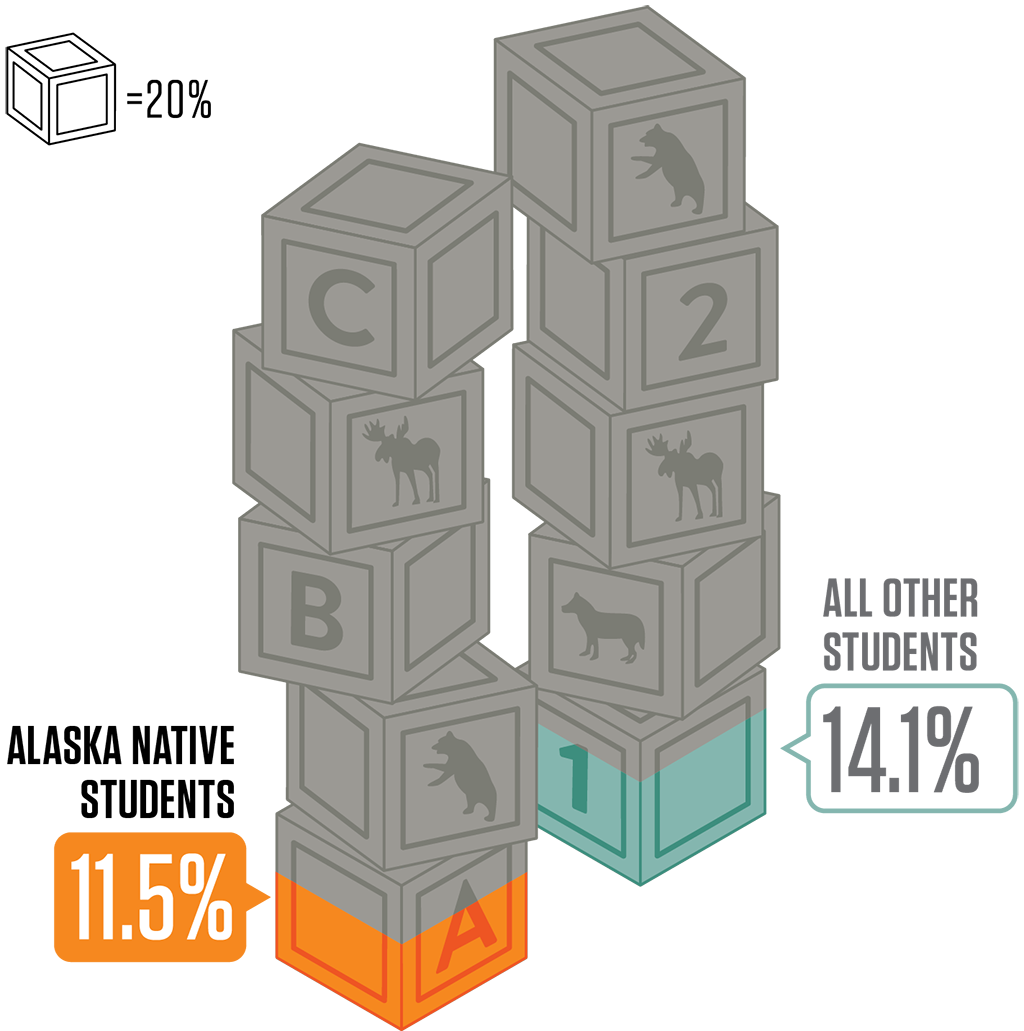
Indicator: The percentage of students prepared for Kindergarten, as demonstrated with an overall score of “2” on the Alaska Developmental Profile (ADP)*

Members of the ARISE Kindergarten Preparedness Community Engagement Group
Children who are ready to learn at the start of Kindergarten will already have mastered a range of skills and abilities that are key building blocks for learning as they move through their education journey.
In Alaska, Kindergarten readiness is assessed by teacher observation using the Alaska Developmental Profile (ADP), an assessment tool developed by the State of Alaska. The ADP assesses students across five areas on a range of skills, including motor skills, how they behave and express themselves in different settings, how they approach challenges, and what they know about numbers and shapes, language, letters and communicating.
There is a 3-point scale (0-2). Getting a “2” on the ADP is the highest score possible, and means a student “consistently demonstrates” a skill or behavior 80 percent of the time.
*This is a new way of looking at this data, as the ADP was originally developed to assess individual students, not to gather information on a group or population of students. Discussion is ongoing, and as more information about the use of the measurement becomes available, the required number of 2s and 1s on the ADP that indicate readiness for Kindergarten may be modified.
Outcome 1 Indicator
Prepared for kindergarten in 2013 - 2014
Of Alaska Native Kindergarteners assessed during the 2013-2014 school year, 11.5 percent scored all 2s. This is a challenge encountered throughout the community as only 14.1 percent of all other (non-Native) Kindergarteners received all 2s. View 2014-2015 dataIndicator: The percentage of Alaska Native students proficient in reading by the end of the third grade according to State of Alaska assessment results*
The State of Alaska student assessment tests are given in early April of each school year. Third grade is the first year students participate in these statewide assessments. One of the main reasons third-grade reading proficiency is so important, and that people hear about it a lot, is because after this point, students aren’t just learning to read, they’re reading in order to learn other subjects.
* The State of Alaska replaced the Standards Based Assessment (SBA) used from 2005-2014 with a new test called Alaska Measures of Progress (AMP). The AMP test will first be administered during the 2014-2015 school year. The data from 2013-2014 and 2014-2015 will not be comparable.
Outcome 2 Indicator
Reading Proficiently At The End Of Third Grade
Of Alaska Native third-grade students who took the Alaska SBA in April of 2014, 79.2 percent scored “proficient.” Of all other (non-Native) students, 88.2 percent scored “proficient.” In this case, proficient means they read, and understand what they read, appropriate to their grade level. “Proficient” is level 3 on a 4-tier ranking scale.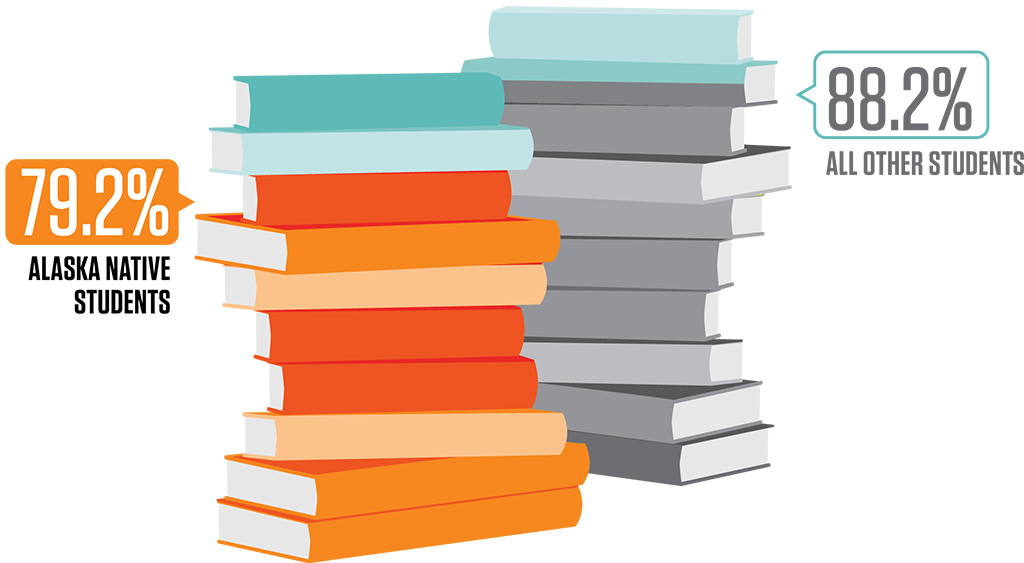
Indicator A: Proficient or higher in math according to State of Alaska assessment results* Indicator B: Completing Algebra I by the end of eighth grade with a B or higher
High school mathematics achievement is a very strong predictor of high school and college success. Most schools offer students a progression up the ladder from Pre-Algebra, Algebra I, Algebra II and geometry, to Trigonometry, Pre-Calculus and Calculus. The earlier a student begins heading up the ladder to more advanced math courses, the higher he or she will be able to climb.
* The State of Alaska replaced the Standards Based Assessment (SBA) used from 2005-2014 with a new test called Alaska Measures of progress (AMP). The AMP test will first be administered during the 2014-2015 school year. The data from 2013-2014 and 2014-2015 will not be comparable.
Outcome 3A Indicator
Proficient or higher in math
During the 2013-2014 school year, 61.9 percent of Alaska Native eighth graders and 71.2 percent of all other students scored “proficient” or higher on their SBA math scores.*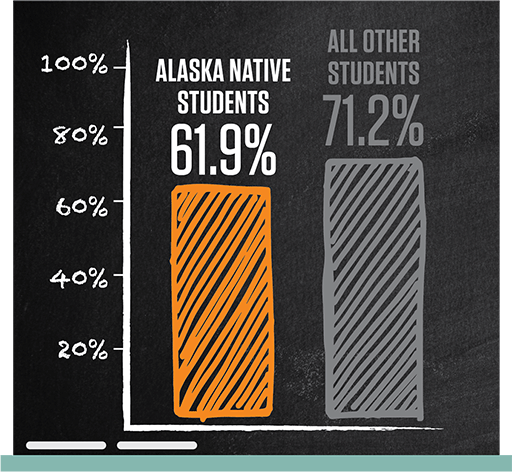
Outcome 3B Indicator
Completing Algebra 1 by end of 8th grade with B or higher
During the 2013-2014 school year, 8.9 percent of Alaska Native eighth grade students and 19.1 percent of non-Native eighth graders completed Algebra I with a grade of B or better.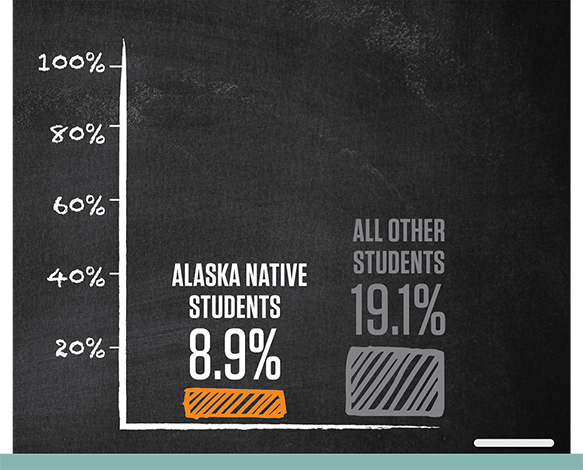
Indicator A: Graduate in four years Indicator B: Graduate in five years
Graduating from high school is an accomplishment that generates benefits throughout a person’s life. graduation can predict higher wages and lifetime earning potential, and the likelihood that a student will go on to further education or training.
To calculate graduation rates, the ASD takes the number of students who graduate at the end of a given year, then divides it by the number of students that began ninth grade four (and five) years prior. Students that transfer in are added, and students that leave (for any reason) are subtracted. Due to the way this calculation is determined, it does not include students that exit the school system prior to entering the ninth grade.
A high school diploma is often one of the basic requirements for employment or post-secondary education and training programs. Our whole community is enriched when Alaska Native young people graduate from high school and make their way into the world where they can add individual and cultural perspective in their workplaces and schools.
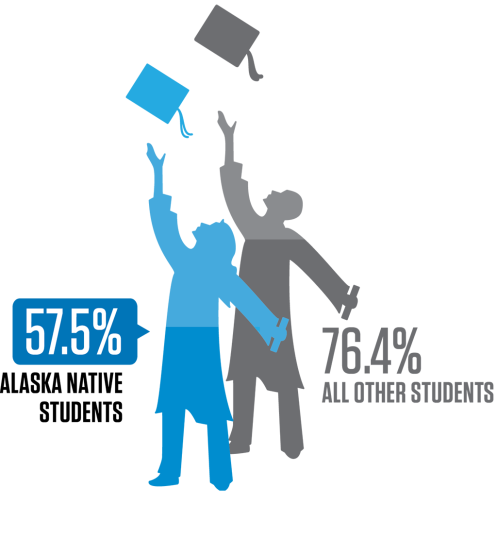
Outcome 4 Indicator A
Graduate in 4 years
Outcome 4 Indicator B
Graduate in 5 years
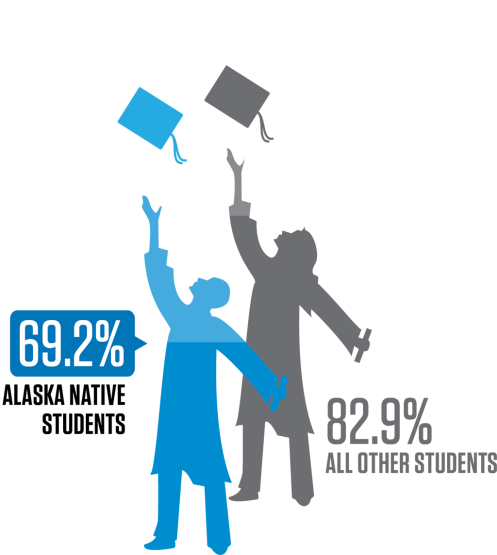
During the 2013-2014 school year, 57.5 percent of graduation-age Alaska Native students graduated within four years of starting high school, and 69.2 percent of students graduated within five years. For all other students, 76.4 percent graduated within four years, and 82.9 percent had graduated within five years of entering high school.
View 2014-2015 data
Indicator: The percentage of students who attend school 90 percent of the days they are enrolled
Students cannot benefit from school if they do not attend. In addition to impacting student learning and success, chronic absenteeism can sometimes signal that a student is experiencing challenges at school or at home.
Outcome 5 Indicator
Attending 90% of school days enrolled
 During the 2013-2014 school year, 74.5 percent of Alaska Native students in the ASD attended school at least 90 percent of the days they were enrolled. Among all other (non-Native) students, 84 percent of students attended at least 90 percent of days enrolled.
View 2014-2015 data
During the 2013-2014 school year, 74.5 percent of Alaska Native students in the ASD attended school at least 90 percent of the days they were enrolled. Among all other (non-Native) students, 84 percent of students attended at least 90 percent of days enrolled.
View 2014-2015 data
Indicator A: Percent of Alaska Native graduates of ASD who qualify for Alaska Performance Scholarship (APS) Indicator B: Percent of Alaska Native graduates enrolling in the UA system Indicator C: Percent of Alaska Native graduates enrolling in technical training – data to be collected
The State of Alaska projects growth in well-paying jobs in Alaska for health care professionals, teachers, pilots, accountants, mechanics, and in construction. Nearly all the “top jobs” require post-secondary education and/or training. For interested Alaska Native students to capture these projected career opportunities, they’ll need to earn post-secondary certificates or degrees. Qualifying for scholarships and enrolling in programs is a good start.
The Alaska Performance Scholarship (APS) is awarded to eligible high school students that qualify—meeting the grade point average (GPA) and SAT or ACT score requirements, and fulfilling certain course requirements. Awards are given at three tiers, and in two tracks—a college track and a career/technical track.
The University of Alaska (UA) system is Alaska’s network of statewide, public institutions of higher education with campuses of varying sizes located throughout the state. While we do not have data on where all Alaska Native student graduates attend college, data on Alaska Native ASD graduates’ enrollment in the UA system is available.
For the 2012-2013 school year, 24.8 percent of Alaska Native students enrolled in the UA system and 29 percent of non-Native students enrolled in the UA system.
The third indicator ARISE will track for this outcome is the number of Alaska Native students enrolling in technical school. Data is yet to be collected for this indicator.
Outcome 6 Indicator A
Alaska performance scholarships
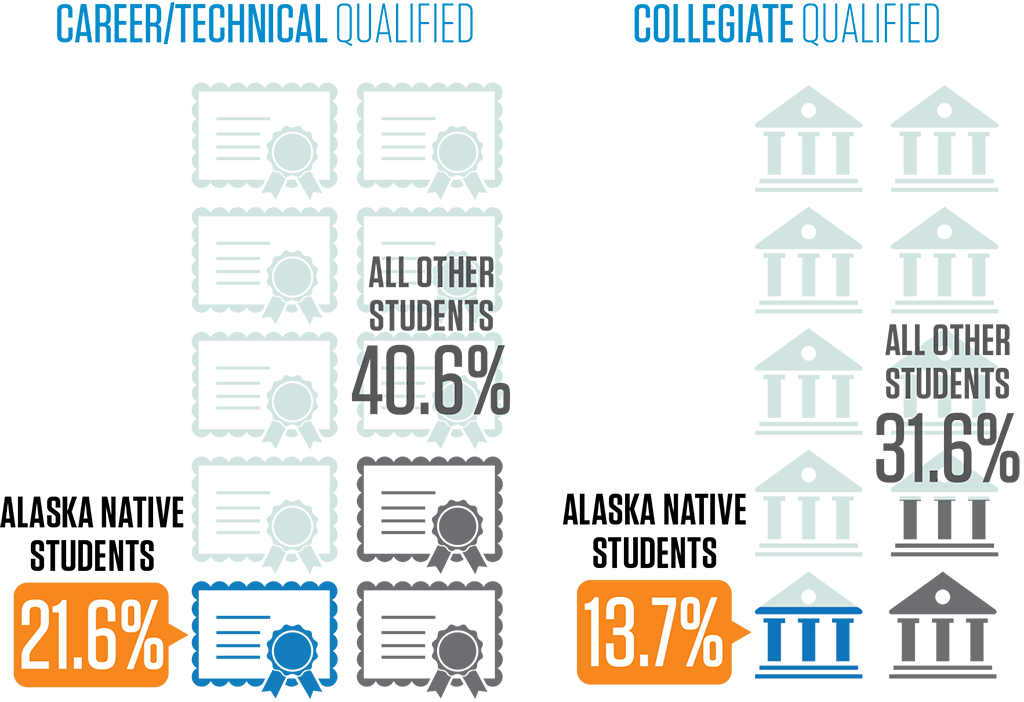
During the 2012-2013 school year, 21.6 percent of eligible Alaska Native students in the ASD qualified for the career/technical APS and 13.7 percent qualified for the collegiate APS. In the same period, 40.6 percent of eligible non-Native students qualified for the career/ technical APS and 31.6 percent qualified for the collegiate APS.
Outcome 6 Indicator B
Enrolled in UA system
During the 2012-2013 school year, 24.8 percent of Alaska Native graduates of the ASD and 29 percent of all other ASD graduates enrolled in the UA system the following year.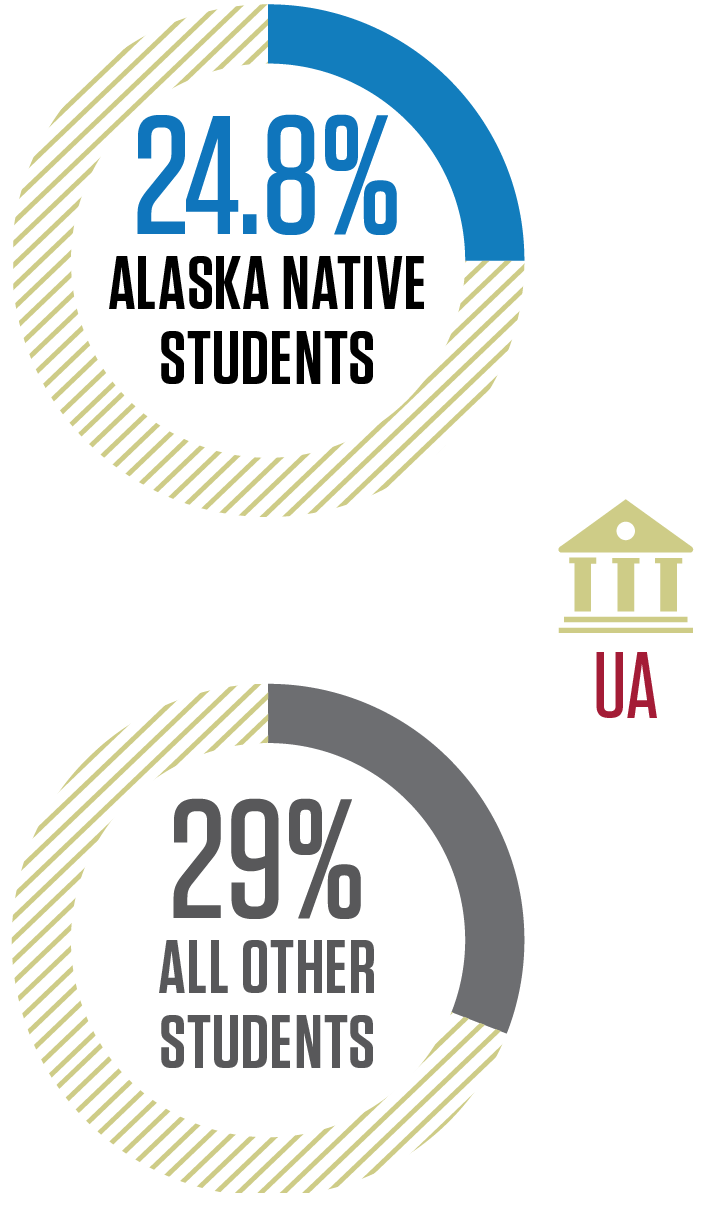
Indicator A: The percentage of students who report feeling connected to their schoolIndicator B: The percentage of students who feel adults in schools, and the community, have high expectations for student success
Many different factors contribute to student success. Schools are directly responsible for some of those factors, like the quality of curriculum and teaching, and positive school climates. School climate describes the extent to which a school offers a positive learning environment. School climates can support or challenge a student’s ability to learn. According to the research, positive school climates are directly related to academic achievement. Each year since 2006, Alaska’s students take a School Climate and Connectedness Survey (SCCS) so that schools and districts can track this important factor.
Most students who report feeling “connected” to school do better academically, but this correlation doesn’t work the same way for Alaska Native students. Alaska Native students rate their school climates as very positive, but don’t enjoy the same academic “bump” from this connection as do other students. ARISE will explore this difference and identify ways to create school climates that result in academic achievement for Alaska Native students too.
The Connected to School part of the SCCS survey taken by fifth through 12th graders is made up of 10 questions specifically about the school environment, such as “At school, there is a teacher or some other adult who will miss me when I am absent,” and “I get along well with other students.”
The High Expectations portion of the SCCS reflects students’ perceptions of the expectations of adults in their school and community, as well as their own expectations of themselves. It’s based on six questions that include “I try hard to do well in school,” and “Adults in my community encourage me to take school seriously,” and “At this school, students are encouraged to work to the best of their abilities.”
Photo courtesy of CITC
Outcome 7 Indicator A
Connected To School
 Of participating Alaska Native students during the 2013-2014 school year, 37.6 percent said they Strongly Agree/Agree that they feel connected to school. More than half (51.8%) of Alaska Native students responding said they Agree Some/Disagree Some. During that same period, 40.8 percent of non-Native students reported that they Strongly Agree/Agree that they feel connected to school, and 49.9 percent reported that they Agree Some/Disagree Some.
Outcome 7 Indicator B
High Expectations For Success
 Of Alaska Native students responding to the survey during the 2013-2014 school year, 67.3 percent of fifth through 12th graders answered that they Strongly Agree/Agree, and 29.3 responded that they Agree Some/Disagree Some. Among non-Native students during the same period, 70.1 percent of students reported that they Strongly Agree/Agree, and 26.9 percent report that they Agree Some/Disagree Some.
View 2014-2015 data
Of Alaska Native students responding to the survey during the 2013-2014 school year, 67.3 percent of fifth through 12th graders answered that they Strongly Agree/Agree, and 29.3 responded that they Agree Some/Disagree Some. Among non-Native students during the same period, 70.1 percent of students reported that they Strongly Agree/Agree, and 26.9 percent report that they Agree Some/Disagree Some.
View 2014-2015 data
Indicator: Indexed SEL score rating Alaska Native students’ perceptions of their own self-awareness, self-management, social awareness and social skills
Social and emotional learning (SEL) focuses on the development of skills such as teamwork, a strong work ethic, decision making, self-discipline, knowledge of strengths and weaknesses, and confidence.
These skills have been shown to be important to students’ overall success in school and in the community. The ASD has led the field nationally in developing and implementing strategies to promote positive development of these important skills. As with the previous outcome, data for tracking this indicator comes from the ASD School Climate and Connectedness Survey (SCCS). The data is self-reported by the students. The score captures whether students can identify their own feelings, control their behavior when frustrated or disappointed, respect people who are different from themselves, and make new friends.
Photo courtesy of CITC
Outcome 8 Indicator A
Social & Emotional Skills
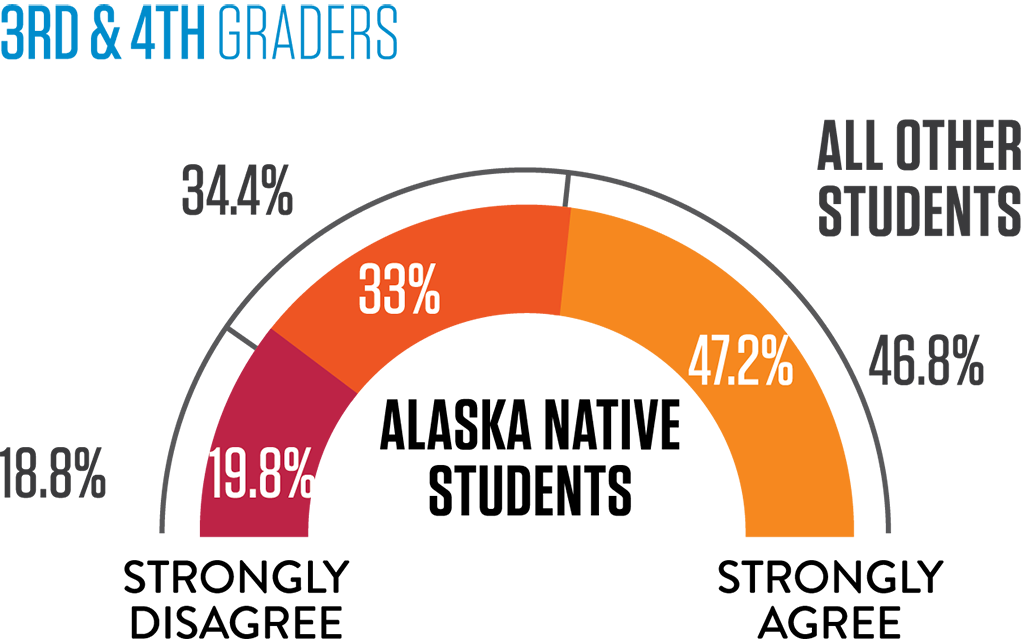
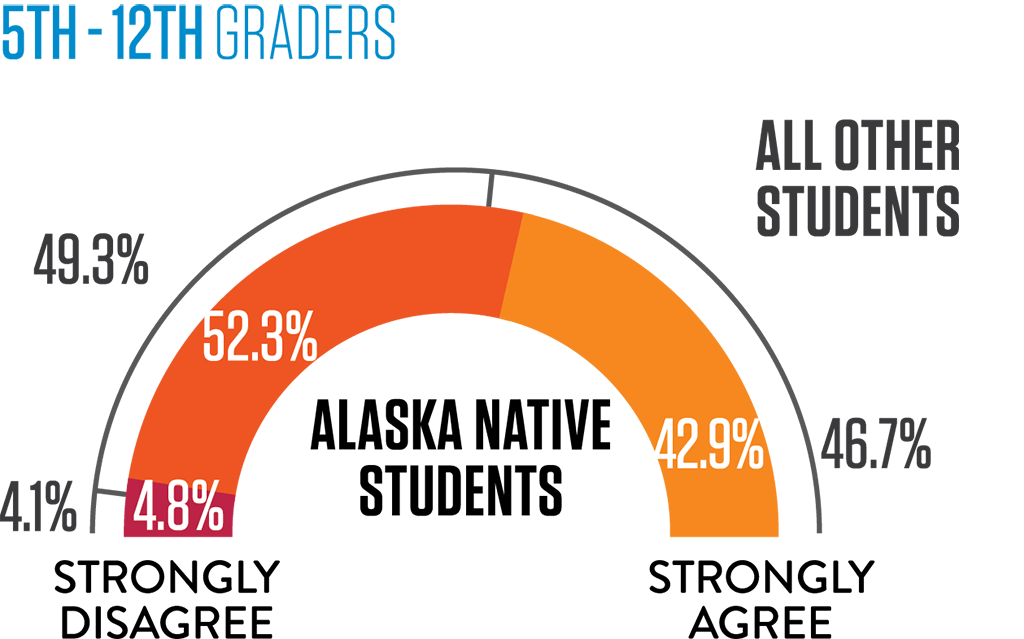
During the 2013-2014 school year, 47.2 percent of Alaska Native third and fourth graders Strongly Agree/Agree that they have high levels of SEL skill, and 42.9 percent of Alaska Native fifth through 12th graders reported that they Strongly Agree/Agree that they demonstrate high levels of SEL skills.
These rates are similar to those non-Native students report. Among all other (non-Native) students, 46.8 percent of third and fourth graders and 46.7 percent of fifth through 12th graders reported that they Strongly Agree/ Agree that they have high levels of SEL skills.
View 2014-2015 data